Account Dashboard
Your Account Dashboard is the home base for tracking your account's performance. Here's a quick guide to the metrics and information you'll see.
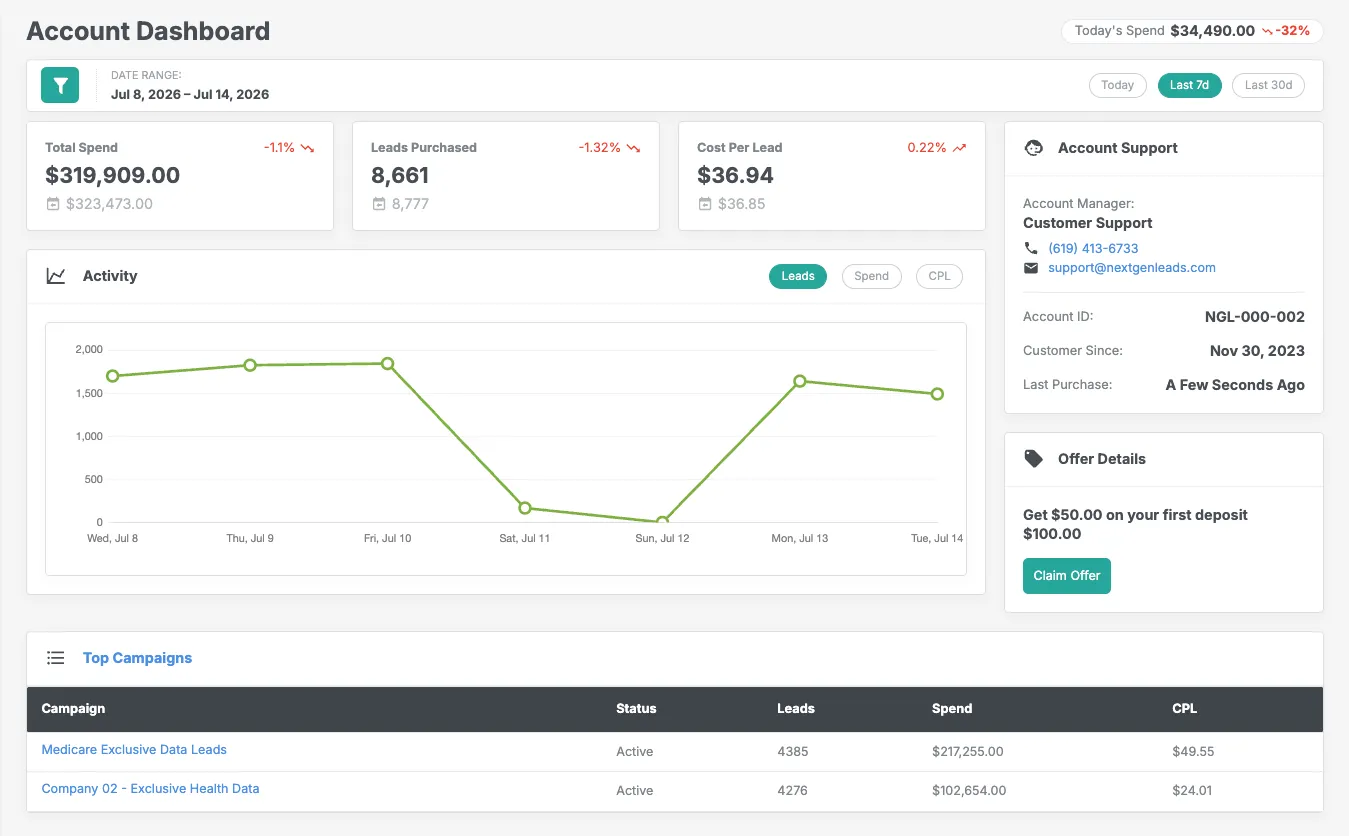
Today's Spend
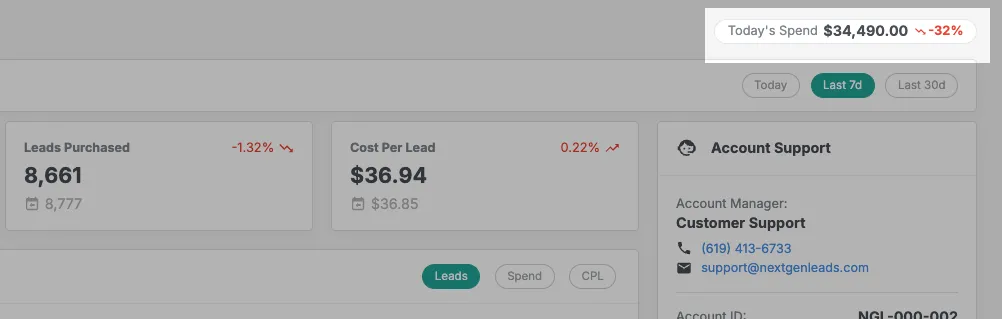
View how much you've spent so far today compared to the week prior.
Date Range
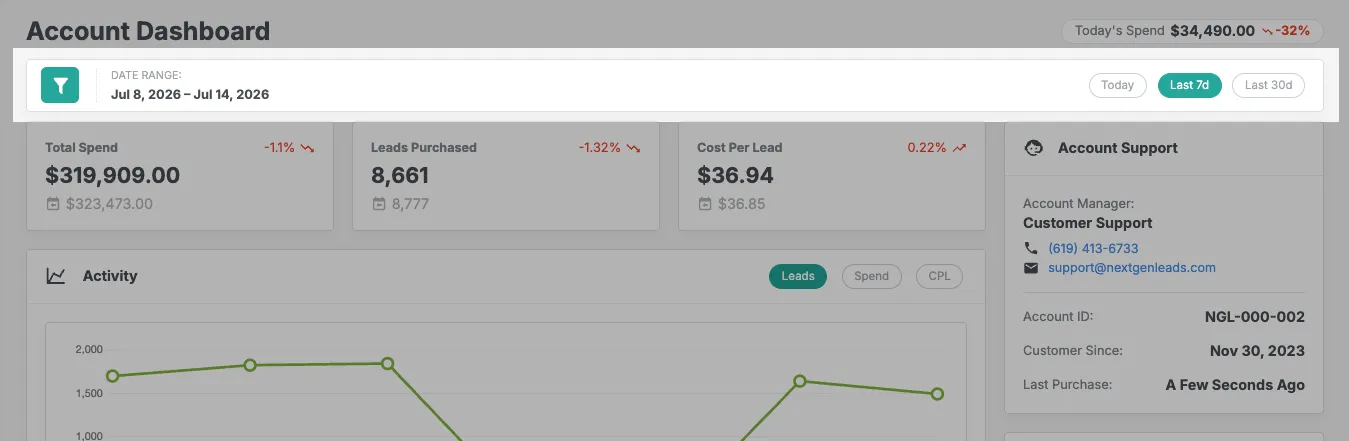
Choose the timeframe for the data below. Options include Today, Last 7d, Last 30d, or a custom range. All metrics and the activity chart update to reflect the selected range.
Top Metrics
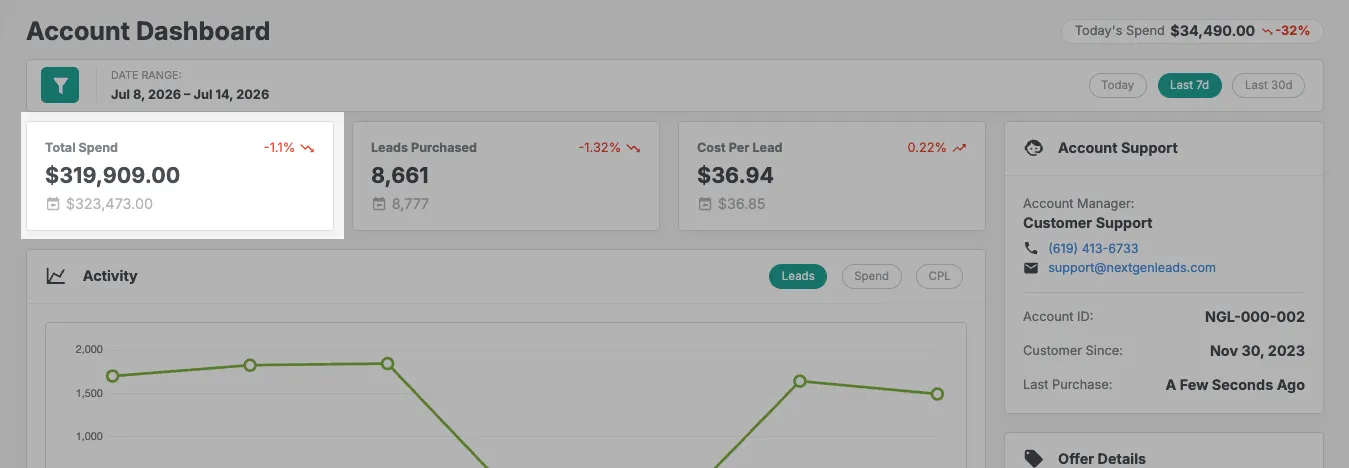
- Total Spend: Your total spend during the selected date range, with a comparison to the prior equivalent period.
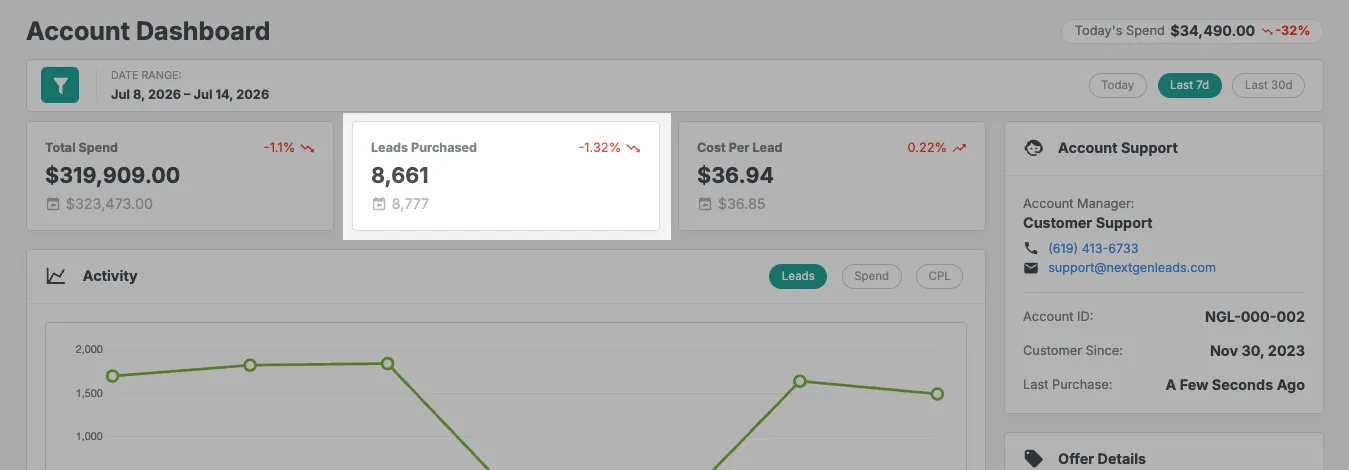
- Leads Purchased: The total number of leads bought during the selected date range, with a prior-period comparison.
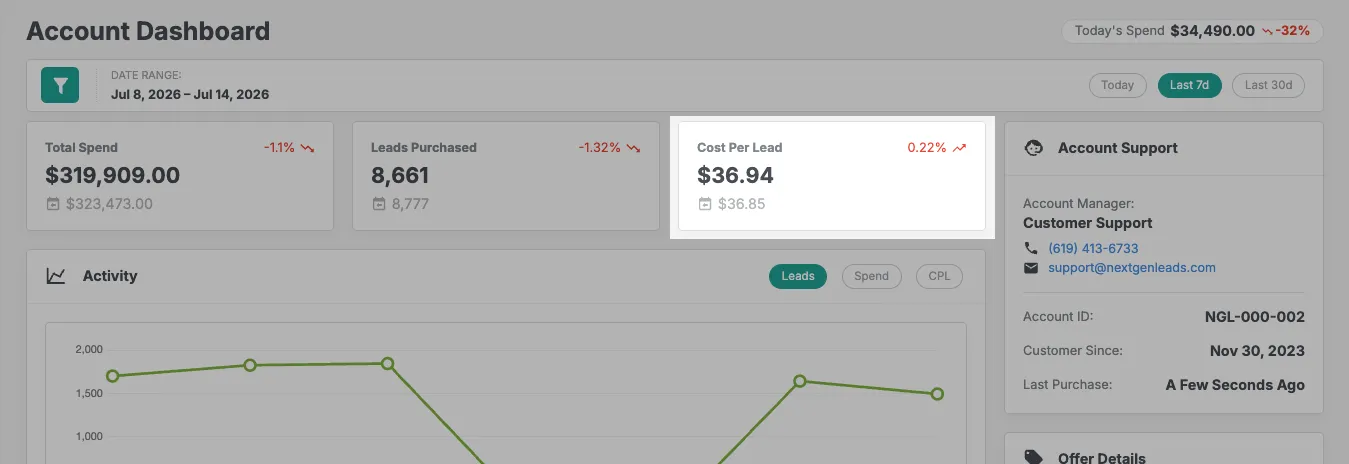
- Cost per Lead (CPL): Your average cost per lead during the selected date range, with a prior-period comparison.
Activity Chart
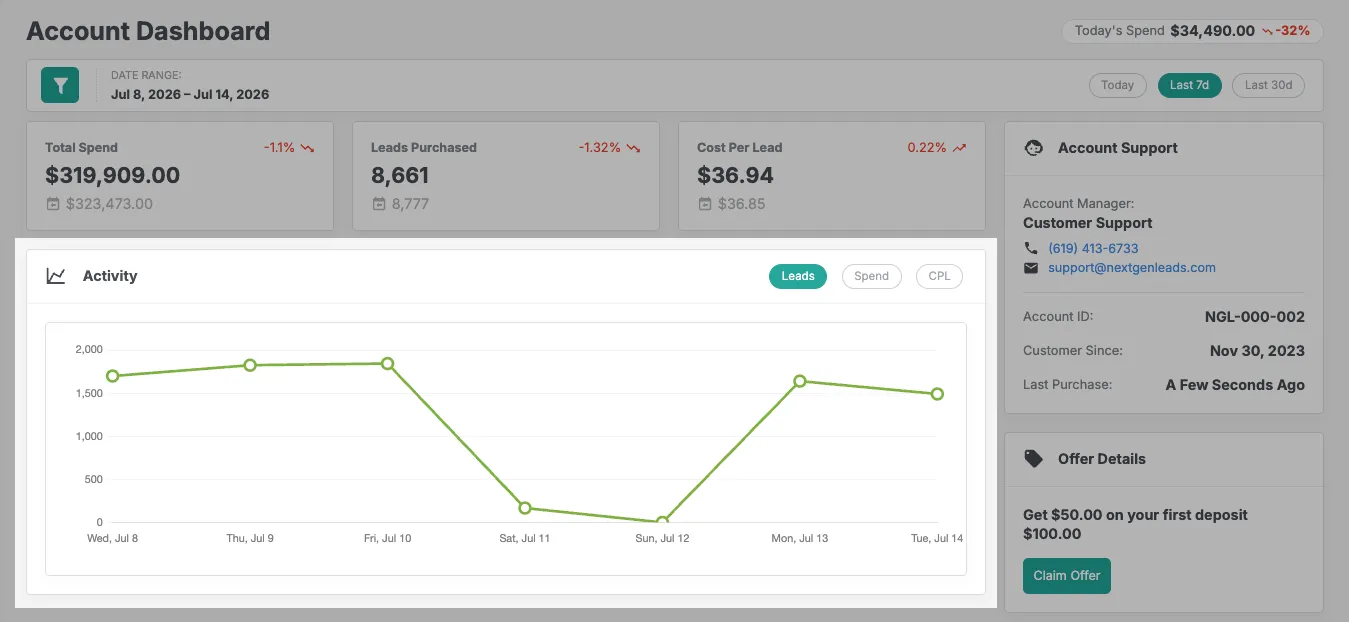
An interactive chart showing performance over the selected date range. Toggle between Leads, Spend, and CPL to see how each metric has trended day over day. Lines are broken out by vertical (e.g. Health Insurance, Medicare) if you have campaigns in more than one.
Account Support
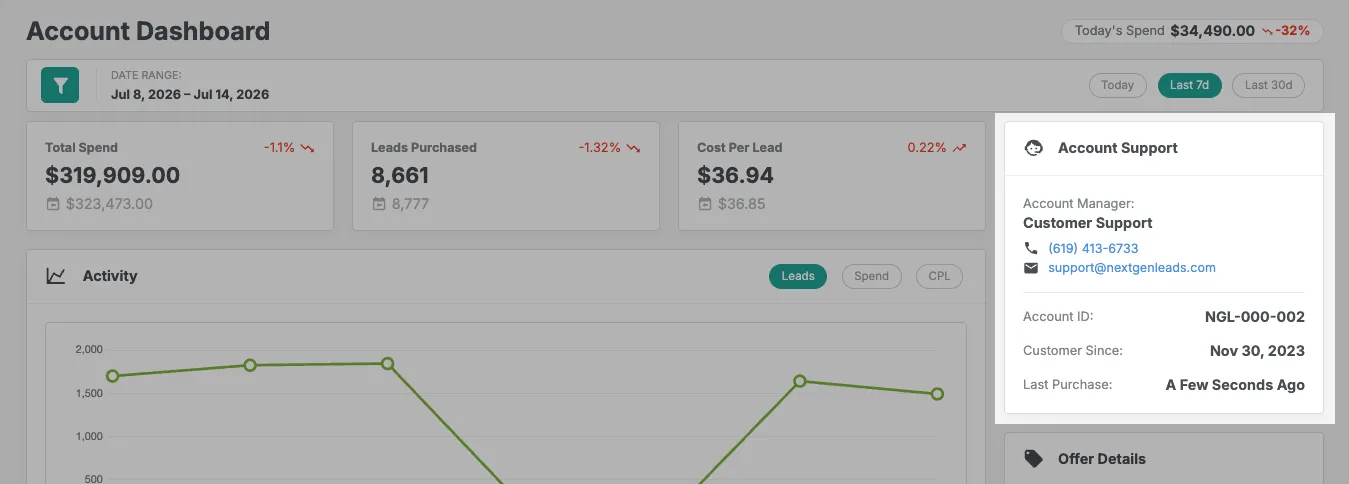
Your dedicated account manager's contact info, along with your Account ID, last purchase date, and customer since date.
Offer Details
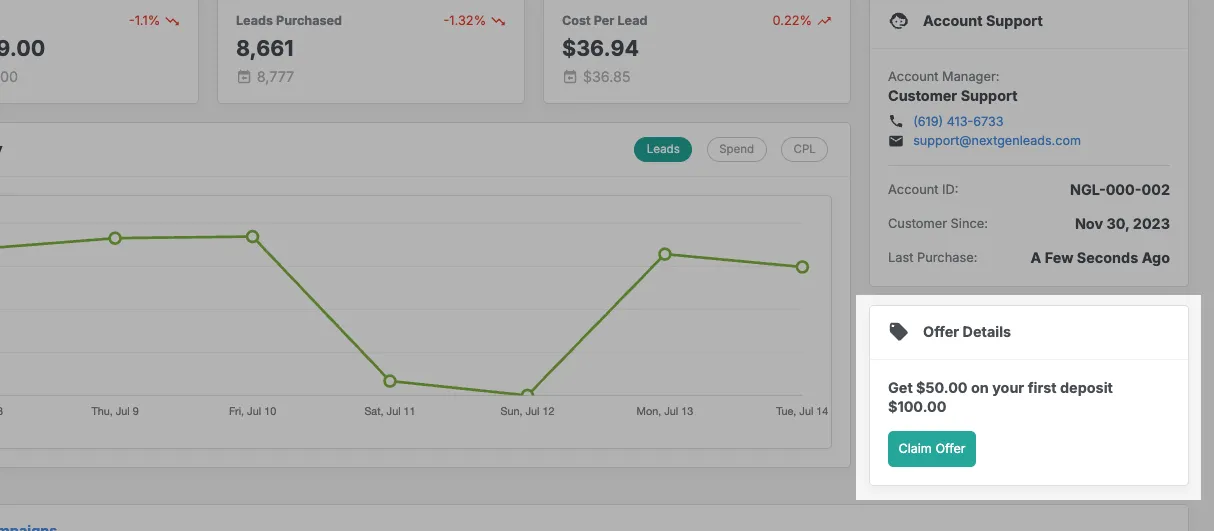
If you have an active promotion on your account, the details will appear here with a Claim Offer button to redeem. If no offer is active, you'll see a field where you can enter an offer code you've been provided.
Top Campaigns
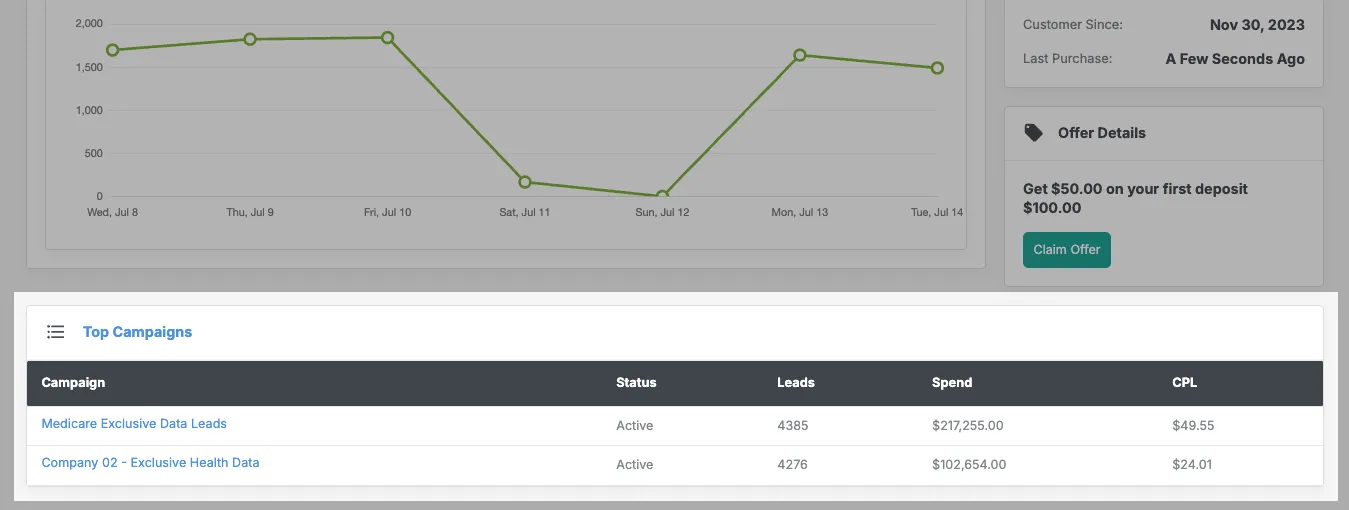
Your active campaigns during the selected date range, showing status, leads purchased, spend, and CPL for each. Click any campaign name to view its full details.